Will the Real Commodities Index Please Stand Up?
Posted: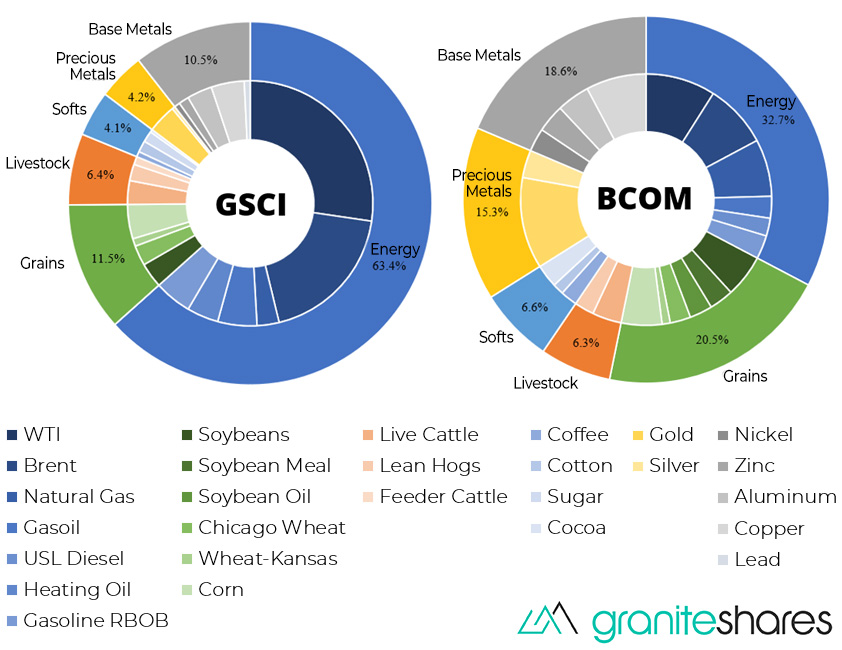
The Bloomberg Commodities Index vs. GSCI
While commodities were among the first assets to be traded on public exchanges, the irony is that this early market innovation should be resistant to the latest one: indexing.
Each index takes a rather different approach to resolving this challenge, often leaving investors asking which index is the right choice as either an investment or benchmark.
Unlike stocks and bonds, commodities do not lend themselves to indexing in an immediately intuitive fashion. Common strategies, such as market cap weighting, simply do not have an analogous parallel in the commodities space. After all, imagine trying to define the market cap of lean hogs as an asset!
Read More: Is Gold Obsolete?
Confronting this challenge, the S&P GSCI Index (GSCI) and the Bloomberg Commodities Index (BCOM) are the two reigning heavyweights in the commodities space. Each index takes a rather different approach to resolving this challenge, often leaving investors asking which index is the right choice as either an investment or benchmark. By examining how they differ in both concept and in practice, we can see how the two indexes may respond to varying investor requirements.
Commodities Uncommoditized
The foremost dilemma in building a commodities index is trying to figure out the level of importance ascribed to each commodity in the index. Equal weighting, for instance, would put frozen orange juice on par with natural gas, hardly reflective of either investor interest or economic reality. More systematic methods are needed not only to create a reflective basket of commodities as a whole, but also to adapt to changes in the commodities space over time.
Commodity Index Snapshot Comparison
| Weighting | Constraints | Exposure | Constituents | |
| GSCI Index | 100% Production | None | Petroleum Focused | 24 |
| BCOM Index | 1/3 Production + 2/3 Liquidity | Individual Minimum 2%, Maximum 15%Derivative Maximum 25%, Sector Maximum 33% | Broadly Distributed | 23 |
The two commonly used frameworks in commodities indexing are production weighting, based on the economic value of the commodities produced, and liquidity weighting, ranking the commodities by how much they are traded. As the example of gold demonstrates, neither model is entirely perfect, for how should one of the least produced but most heavily traded assets be handled? Nonetheless, these are the two building blocks for GSCI and BCOM index construction, with the GSCI using 100% production weighting and BCOM using 1/3 production weighting, 2/3 liquidity weighting. This reliance on liquidity weighting by BCOM in and of itself fosters a more balanced index, as commodities are more evenly traded than they are produced.
Rules, Rules, Rules…
If the choice of weighting schema is the first key difference between the two commodity indices, the use of index constraints is the second. The GSCI index is notable for its unrestrained approach to balancing commodity exposures, allowing the index to float freely as relative levels of production shift. Aside from basic liquidity measures, the only rule built into the index is production weights are based on the average output over the past five years; this requirement prevents one extraordinary year from skewing the index. Consequently, the GSCI is unencumbered in reflecting the often dramatic shifts of the underlying commodities market.
Equal weighting, for instance, would put frozen orange juice on par with natural gas, hardly reflective of either investor interest or economic reality.
In contrast, the BCOM index assumes a much more regimented weighting strategy. Not only are individual commodities capped at a 15% allocation, but all variations on the same commodity are limited to a maximum of 25% (for instance WTI crude and Brent crude). Additionally, no commodity sector, such as energy or livestock, can exceed a 33% allocation, and each commodity must have at least a 2% allocation. These simple rules force the BCOM index into a broadly distributed mold, preventing any one commodity from overtaking the index.
Commodity Index Composition Comparison
Source: Bloomberg and GraniteShares Research
Down to the Physical
Moving from theory to practice, these combined differences in weighting and constraints result in two rather dissimilar end products. The diagram above depicts just how disparate these indices are; visually GSCI has far more blue (energy) at the expense of grey and yellow (base and precious metals, respectively) in its composition. This nearly doubled energy exposure results from the production weighting focus of GSCI; while crude is the most traded commodity by far, it is the most produced commodity by an even greater margin.
Related: How Much of Income is Mental?
Another immediate disparity is that the BCOM index distributes its weight much more evenly, curtailing exposure to the largest commodities and increasing weights to the smallest allocations. For instance, the BCOM index gives over 3 times the weight to the smallest five commodities as the GSCI index does, a direct consequence of the robust constraints featured in the BCOM index. BCOM therefore avoids having many of the token exposures contained in GSCI, at the expense of potentially overweighting what may be a minor commodity.
Correlation of Commodity Indices Against Oil
Notes: Single-factor regression of the GSCI and BCOM Indices against oil on a weekly basis over the 10-year period beginning 5/1/09 to 4/19/19. Oil is represented by the active West Texas Intermediate (WTI) Crude futures contract. R2 is a goodness of fit measure expressed on a scale of 0 to 1, where 0 indicates no fit between the data sets and a perfect fit. Source: Bloomberg.
Taking a more quantitative perspective, the data underscore petroleum’s greater influence in the GSCI index as well. The charts above show a ten year weekly regression of the two commodities indices against West Texas Intermediate (WTI) crude. Notice how the GSCI plot forms a much tighter, and steeper, line than the much more globular BCOM results, indicating a stronger and more sensitive relationship to oil movements.
In fact, fully 84.5% of GSCI’s returns are explained by oil movements with a correlation of 0.919, on par with how the NASDAQ correlates with the S&P 500. As a corollary, this implies that only 15% of GSCI returns are accounted for by factors other than oil. By contrast, oil explains a still substantial 53.5% of BCOM index performance for a correlation of 0.731, which for a point of reference is similar to how real estate correlates with the S&P 500.
A common red herring in this pursuit is to select the index with higher performance, but this action misses the point of why it would be desirable to index commodities in the first place.
Which Index Should Stand Up Then?
The perennial question facing commodities investors is which index is better, and perhaps anti-climatically, the answer is rather open-ended. A common red herring in this pursuit is to select the index with higher performance, but this action misses the point of why it would be desirable to index commodities in the first place. The purpose is not simply to chase performance, but instead to build as representative a basket of commodities as possible. Otherwise the advisable option would be to pile into high-beta equities and bitcoin.
Learn More: Madness in the Metals- What Will 2020 Bring?
The unavoidable difficulty is in trying to rank the relative importance of commodities, and on this point investors can reasonably disagree due to varying perspectives and purposes. Any investor would surely concede that petroleum is a more important commodity than coffee, but by precisely how much? Is it eleven times as important as per weightings in the BCOM index, or eighty-five times more significant as the GSCI index would suggest?
Answering questions like these is part of the art to modern finance. We may have algos and high frequency trading, but for now this is a field well open to the value of human judgement.