Income Blueprint: HIPS Income Replacement
Posted:
Income is one of the most basic, yet important needs of any portfolio—the capacity to generate enduring cashflows to fund expenses. While searching for sustainable yield is never easy, over the last decade income investing become a most unpalatable cocktail — one part frustration and two parts despair (add bitters to taste). These were the difficulties that pervaded income investing before COVID-19 struck, an economic shock that redoubled the income challenge to near unimaginable levels.
With 10-year treasuries near all-time lows after the Federal Reserve embarked on an emergency easing cycle, the hunt for yield will only intensify. While this return to 0% interest rates has propped up stock prices, it has simultaneously decimated fixed income yields while also raising the specter of inflation. Combined with the $100 billion in cut dividends, 2020 is on track to be one of the worst economic environments for yield-focused investors. What is a saver to do, and what options are available?
Alternative yield may present a solution to what may be a confounding dilemma of our time. Consisting of Pass Through Securities, these assets carry the potential for very high levels of income as, not only do they pay out substantially all of their earnings to shareholders, but they tend to avoid paying taxes at the corporate level. The GraniteShares HIPS U.S. High Income ETF HIPS—ticker short for High Income Pass Through Securities—combines up to 60 pass through investments across four economic sectors for optimized diversification. Importantly, this alterative income vehicle yielded 10.97% as the end of the third quarter, 09/30/2020. 1 The investment case for alternative income as represented by HIPS centers on four core propositions:
- Limitations to Conventional Income Strategies
- Characteristics of Alternative Income
- Strategic Advantages of the HIPS ETF
- HIPS as a Vehicle for Pursuing Financial Goals
Our core thesis is not that high income opportunities do not exist, merely that investors have been conditioned to look for yield in all the wrong places. Whether retirees, long-term savers or anyone looking to diversify their returns, alternative income reimages yield potential for a post COVID-19 economy.
Yielding a Problem: Conventional Income
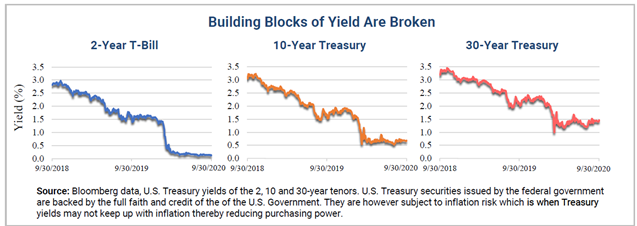
The unfortunate reality is that a deep chasm stands between investor income requirements and what conventional strategies can now yield. Even a quick examination of bond markets uncovers intractable difficulties. Not only has the 10-year treasury yield declined by 258 basis points from its November 2018, as depicted it the center chart below, but it made fresh lows of only 0.39% (1 basis point [bp] = 0.01%). This represents a staggering 80% decline in income distributions from what where already historically diminutive levels!
The right and left-hand charts below further illustrate the severity of the current yield desert, documenting the outright collapses in both the 2-year and 30-year treasuries (282 and 205 basis point decreases, respectively). These parallel losses extending through-out the yield curve underscore there is no escape to this evaporation of yield—imagine receiving $69, or worse $13, for every $10,000 lent to the federal government. This is a crisis of the first magnitude for yield-focused investors, as these charts below constitute the foundation for all other types of conventional income available in the market. In essence all other standard income investments are merely a series of premiums stacked atop these baseline yields—the inescapable conclusion is that the building blocks of yield are broken, no matter where you look.
Down the Yield Rabbit Hole
In a market where every basis point of income counts, many yield-focused strategies simply do not generate as much income mileage as may be imagined. For a full analysis of the yield ecosystem, we will proceed through progressively higher yielding asset classes, using industry-standard indices as outlined in the table below. Importantly, we will consider potential after-tax returns for an unbiased assessment of effective cash payout, with all cited yields as of 9/30/2020.
As a baseline, consider that after a four-year Herculean effort to normalize rates, the Fed’s recent emergency actions reset the clock on zero interest rates; many strategies failed to generate positive real after-tax distributions. Beginning with the bread and butter of any income portfolio, the Bloomberg Barclays Aggregate Bond Index, commonly referred to as the Agg, yielded 2.05%. After an assumed 40% marginal income tax rate*, this number fell to a paltry 1.23% unable to keep pace with inflation. This math simply may not work for too many investors.
Show Me The Money: Yield by Asset Class
| Asset Class | Proxy Index | Yield |
|---|---|---|
| Equities | S&P 500 Index | 1.79% |
| Bonds | Bloomberg Barclays Aggregate Bond Index | 2.05% |
| High Dividend Equities | FTSE High Dividend Yield Index | 3.48% |
| Real Estate | Dow Jones Equity REIT Index | 3.98% |
| High Yield | iBoxx USD Liquid High Yield Index | 5.13% |
| Closed-End Funds | S-Network Composite Closed-End Fund Index | 8.77% |
| BDC’s | S&P BDC Index | 12.79% |
| MLP’s | Alerian MLP Index | 17.25% |
| Alternative Income | TFMS HIPS Index | 10.97% |
| Source: Bloomberg (as of 9/30/20). Past performance is not a guarantee of future returns. One cannot invest directly in an index. | ||
Even large cap stocks such as represented by the S&P 500, maintained a 1.79% dividend yield as of the end of August 2020, for 1.43% income on an after-tax basis. This situation very much illustrated the “you can’t get there from here” problem inundating income investing. Bonds have become so anemic the stock market was a more effective yieldgenerator, with large caps holding a 20 basis point edge for income after taxes. This reversal of historical precedent illustrates the predicament, and indeed folly, facing investors in securing their financial goals.
No combination or permutation of conventional income approaches 7% yield, even while assuming progressively greater levels of risk and volatility.
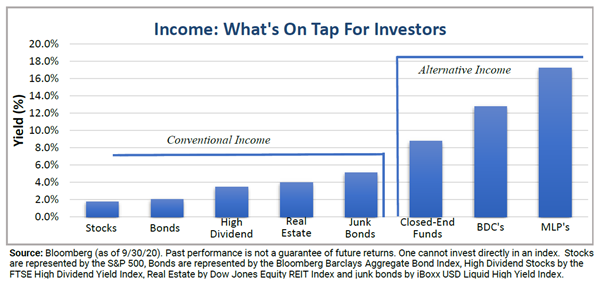
Moving up the yield food chain, the next stop after ordinary stocks and bonds is real estate. While traditionally considered a yield-oriented investment driven by rents and mortgage payments, the Dow Jones Equity REIT Index managed only 3.98%--at least now we have crossed the 1% real after tax mark. Further along is high dividend stocks, where the FTSE High Dividend Yield Index yielded 3.48%. While segmenting out the top echelons of dividend issuers doubles the yield available standard equity dividends, we are still only 60% percent of the way to the 7% yield rule of thumb commonly targeted for sustainable income portfolios.
The final conventional income asset class is high yield or junk bonds, which achieve higher interest rates in exchange for the assumption of greater credit and potential liquidity risk. The iBoxx USD Liquid High Yield Index, for instance, produced a 5.13% income stream. The less favorable tax treatment of interest income, however, reduced this seemingly impressive number to 3.08% on an aftertax standard, 29bps greater than high dividend stocks but 10bps less than real estate.
The intractable problem facing any investor is this threshold is the upper limit, the event horizon, to income yields with mainstream strategies. No combination or permutation of any of these asset classes can approach 7% income, even while assuming progressively greater levels of risk and volatility. The question remains then, what out of the box strategies can investors consider for real income? Welcome to the world of alternative income and pass-through securities.
Alternative Income: Finding Yield in the Desert
The solution to this income stream problem may lie in an ecosystem of alternative investment beyond the frontier of conventional options. The three prominent contenders in this high-yield arena are Closed-End Funds (CEFs), Business Development Companies (BDCs) and Master Limited Partnerships (MLPs). These alternative structures yielded 8.77%, 12.79% and 17.25%, respectively, as of 9/30/20.
What these assets have in common is they may exploit unique fund structures or target specific risk profiles to hit income in excess of traditional methods. Their pass-through structures tend to avoid the double-taxation phenomenon, enabling unique yield opportunities for the end investor. This characteristic of pass-through securities constitutes a two-fold advantage for yield investors: not only are shareholders entitled to nearly all of a company’s earnings as income, but this income can be shielded from taxation at the corporate level. Let’s examine these specialized investment categories in turn.
- Closed-End Funds (CEFs) By using the gambit of their own internal leverage—Closed-End Funds are able to issue their own debt and preferred shares up to 50% and 100% of net assets—to augment their exposure to high-yield debt. In exchange for increased volatility, the CEF structure enables investors to figuratively “double-down” on speculative-grade yields, while the potential to purchase CEFs below net asset value can further enhance this effect.
- Business Development Companies (BDCs) Next in line, business development companies are investment firms that specialize in funding small, distressed or emerging ventures in either the public or private investment ecosystem. Based on a fund structure created in 1980, BDCs operate in a fashion not dissimilar to private equity or venture capital, leveraging their internal capital structure for the potential to distribute sizable yields to their equity stakeholders.
- Master Limited Partnerships (MLPs) The final heavy-yield contenders, which were created in 1981 but restricted to only the energy and real estate sectors in 1987, as Congress thought the structure was too tax-advantaged. MLPs are a unique cross between a partnership and a corporation that can be publicly traded and employ a pass-through structure to avoid double taxation. Not only do most distributions constitute return on capital, but depreciation and losses can even be passed on to investors as well.
As may be surmised through their descriptions, these alternatives are willing to make unorthodox tradeoffs to earn their high-income status. For instance, CEFs concentrate heavily on interest rate and credit risk, and BDCs by nature focus on at-risk or immature companies. The point is, each of these categories alone may be susceptible to specific shocks, whether in terms of overall market risk or even structure specific risk. A diversified approach that combines these varying asset classes may be less volatile overall, and may reduce exposure to any single type of risk. Moreover, a balanced approach to passthroughs can help maintain income through varying market conditions, a need the recent pandemic has highlighted.
HIPS & Income Replacement Potential
The fact is many investors may be underexposed to alternative income solutions, simply because they fall outside the framework of common market indexes. The GraniteShares HIPS ETF provides a complete, plug and play vehicle for accessing alterative income. With up to 60 individual holdings spanning four assets categories (CEFs, BDCs, MLPs and REITs), HIPS yielded 10.97% as of 9/30/20. Significantly, HIPS achieved a nearly 16 times greater yield than the 10-Year Treasury, and over six times higher income than realized by the broad market. Yet perhaps most resounding, HIPS locked in a 7.98% distribution premium over high-dividend stocks—a potent tool for augmenting portfolio income and financial freedom.
Alternative income can serve numerous roles, from augmenting an equity sleeve’s yield, diversifying fixed income exposure, or even as a standalone allocation.
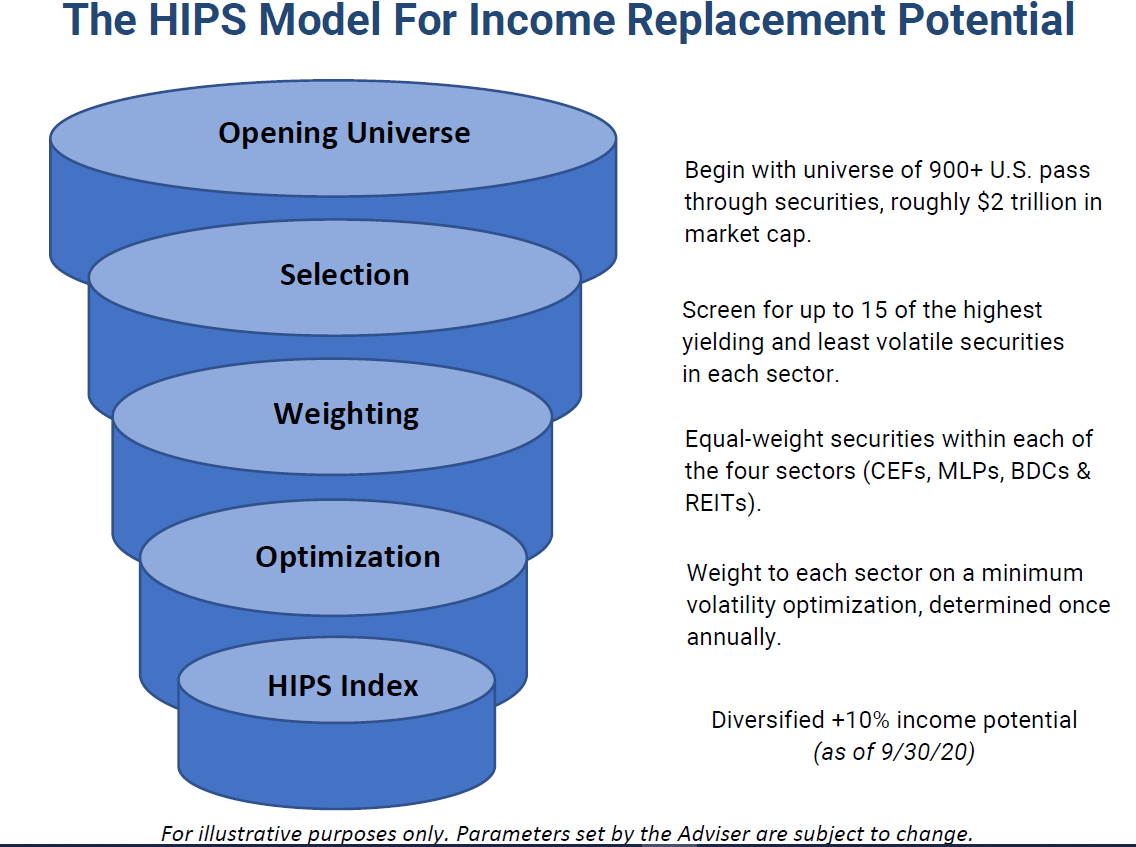
Precisely how did the HIPS ETF accomplish this feat, distributing a steady 10.75 cents per share since fund inception in January 2015? The HIPS Index uses a multi-faceted approach aiming to not only diversify its investments throughout the Pass-Through ecosystem, but also to optimize risk efficiency. Potentially just as important as gaining access to alterative income is layering different risk factors together. By establishing multiple independent streams of income, investors may seek robust yield potential throughout all stages of the economic cycle, even periods of market stress.
Inline with this diversified income philosophy, HIPS begins by scouring the network of more than 940 Pass Through Securities, comprising over $2 trillion in market capitalization. As depicted in the diagram above, the HIPS methodology then selects, for each of the four categories, the 15 assets that are both the highest yielding and the least volatile. Specifically, this screening takes the highest quartile by investment income, and ranks them by volatility over the past year—the idea being to seek very high levels of income in as risk-efficient manner as possible.
After selecting investments, HIPS moves on to the weighting process. In each sector, HIPS creates a sub-portfolio where all investments are equalweighted, meaning the 15 BDCs each receive equivalent weight to each other, as will the 15 REITs and MLPs and CEFs. Allocations to sectors themselves, however, are not equal-weighted. January each year, a Minimum Variance Optimization determines the sector weights, a classic extension of Markowitz’s Modern Portfolio Theory. Each sector is assigned a minimum 15% allocation, while MLPs are subject to a 25% hard cap to maintain a balance of fund exposures.
From the outset not only are the least volatile securities picked, but the sectors are subsequently weighted to take advantage of their cross-correlations. Volatility control, therefore, is a guiding impulse in not only security selection, but in asset allocation as well. This two-fold process keeps with HIPS’ strategy of seeking maximum yield while simultaneously managing risk. This hands-off methodology is how HIPS achieved its 10.97% distribution as 9/30/2020—yet this figure may understate the income potential of HIPS. Since fund inception, over 50% of HIPS distributions have historically counted as Return on Capital (ROC) from the underlying investments, and may not be subject to taxation.
Alternative Income in The Broader Portfolio
The potential for 10% income through historically consistent cash payouts may exert a powerful impact not only on current finances, but on one’s future outlook. Nonetheless, an important question regarding alternative income is how best to integrate this strategy into a broader portfolio. Indeed, alternative income can serve numerous roles, from augmenting an equity sleeve’s yield, diversifying fixed income exposure, or even as a standalone allocation.
| Model Portfolio | Portfolio Yield | Percent Yield Increase | Yield Increase (per $100,000 invested) |
|---|---|---|---|
| Baseline 60/40 | 1.89% | 0% | 0 |
| 5% HIPS | 2.35% | 23.9% | $454 |
| 10% HIPS | 2.80% | 47.9% | $907 |
| 15% HIPS | 3.26% | 71.8% | $1,361 |
| 20% HIPS | 3.71% | 95.7% | $1,815 |
| 25% HIPS | 4.16% | 119.7% | $2,269 |
| 30% HIPS | 4.62% | 143.6% | $2,722 |
| 35% HIPS | 5.07% | 167.6% | $3,176 |
| 40% HIPS | 5.53% | 191.5% | $3,630 |
| 45% HIPS | 5.98% | 215.4% | $4,084 |
| 50% HIPS | 6.43% | 239.4% | $4,537 |
| Source: Bloomberg Data. Model portfolio yields constructed using yields reported 9/30/20. Right two columns indicate increases over baseline 60/40 portfolio yield. Dollar Yield Increase reflects growth to portfolio income per 100,000 invested. Past performance is not a guarantee future returns. | |||
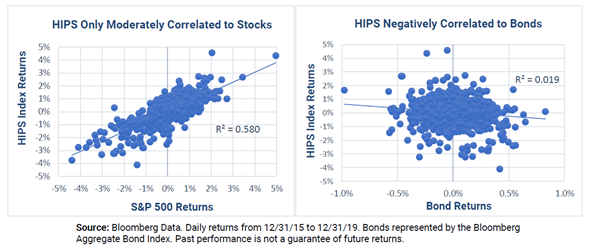
Many alternative yield categories, and HIPS in particular, straddle the divide between conventional equity and fixed income strategies, representing a hybrid stock-bond exposure. As illustrated in the diagrams above, the HIPS index is moderately correlated to the S&P 500, explaining 56% of daily movement, and is negatively correlated to Aggregate Bonds at -0.19. These data indicate alterative income may serve as a valuable diversifier of risk in both asset categories, helping to moderate portfolio volatility.
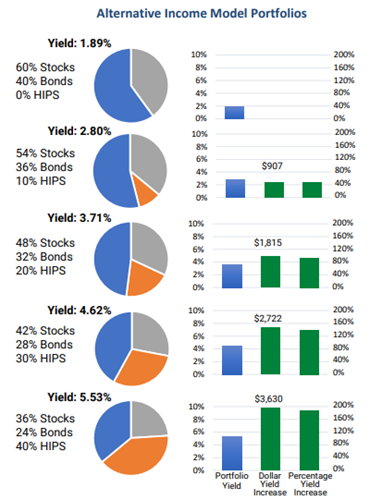
Consider the impacts of blending alternative income into an existing 60/40 portfolio, meaning 60% stocks and 40% bonds, on a proportionate basis. The diagram to the right illustrates the potent effects of adding HIPS to a conventional 60/40 in 10 percentage point increments to span a range of income needs. The results from adding HIPS were both immediate and resounding, even at the initial allocation of only 10% (structured as a 54/10/36 portfolio). For instance, a 1 in 10 allocation to alternative income increased the equity sleeve’s yield by 51%, and overall portfolio income by 43%. Overall yield was doubled with a 21% allocation to HIPS, and for those targeting very high income, a 40% allotment to alternative income boosted yield nearly three times to 5.53%.
Even while occupying only a minority of the portfolio, HIPS enhanced the income of the 60/40 strategy well beyond what conventional “high income” assets could manage, even if they assumed a 100% allocation. In strict dollar to dollar terms, the 40% allocation resulted in an additional $3,630 in annual distributions over the baseline 60/40 per $100,000 invested. While yield should not be the exclusive concern in financial planning, as any approach requires a balanced assessment of risk, higher yields may offer more options in the context of long-term wealth-management. Alterative income accesses via the HIPS ETF may represent a potential solution in the yield desert.
What Does Income Mean to You?
Even before the outbreak of COVID-19, opportunities for meaningful yield had already been receding beyond reach. Indeed, the last time the Fed dropped interest rates to zero, it took seven years before the courage could be mustered to raise rates once more. Currently, there are no forecasts for positive rates resurfacing—the outlook for income has been indefinitely postponed.
Confronted with this extreme environment, the traditional playbooks for generating portfolio income cannot meet realistic investor expectations; most cannot even produce positive real after tax yields. In this context, alternative income strategies utilizing pass through securities may present an attractive solution to yield-starved investors. The HIPS ETF spans four categories of pass throughs, including CEFs, BDCs, MLPs and REITs, seeking diversified and sustainable sources of very high-income levels. Given that HIPS yielded 10.97% as of the end of Q2, high income strategies are a very real possibility, even in this market. Livable income may no longer be out of reach.
Important Information
Investing involves risk; Principal loss is possible.Investments in debt securities typically decrease when interest rates rise. This risk is usually greater for longer-term debt securities. Investments in lower rated and non-rated securities present a greater risk of loss to principal and interest than higher-rated securities. Investments in foreign securities involve greater volatility and political, economic, and currency risks and differences in accounting methods. Investments in smaller companies involve additional risks, such as limited liquidity and greater volatility.
To obtain a prospectus, please click on the link, graniteshares-etf-trust-prospectus.pdf For standardized HIPS returns, please click here. All yields as of 9/30/2020, unless stated otherwise.
Master Limited Partnerships ("MLPs") are subject to certain risks inherent in the structure of MLPs, including complex tax structure risks, limited ability for election or removal of management, limited voting rights, potential dependence on parent companies or sponsors for revenues to satisfy obligations, and potential conflicts of interest between partners, members and affiliates. Investments in asset-backed and mortgage-backed securities include additional risks including credit risk, prepayment risk, possible illiquidity, and default, as well as increased susceptibility to adverse economic developments. A Real Estate Investment Trusts ("REIT’s") share price may decline because of adverse developments affecting the real estate industry. REITs may have limited financial resources, may trade less frequently and in limited volume, and may be more volatile than other securities. The risks of investing in REITs include certain risks associated with the direct ownership of real estate and the real estate industry in general. Business Development Companies ("BDCs") may carry risks similar to a private equity or venture capital fund. BDCs usually trade at a discount to their NAV because they investing unlisted securities and have limited access to capital markets. Closed-end Funds ("CEFs") may be subject to leverage, liquidity risk, credit risk, and losses may be magnified due to the use of leverage. leverage may increase the risk of loss and cause fluctuations in the market value of the Fund's portfolio, to have disproportionately large effects or cause the NAV of the Fund generally to decline faster than it would otherwise.
Unlike mutual funds, ETFs may trade at a premium or discount to their net asset value. Shares of any ETF are bought and sold at market price (not NAV) and are not individually redeemed from the Fund. Brokerage commissions will reduce returns.
An investment in the Fund does not receive the same tax advantages as a direct investment in a Pass-Thru Security. Funds accrue deferred income taxes for future tax liabilities associated with the portion of Pass-Thru Security distributions considered to be a tax-deferred return of capital and for any net operating gains as well as capital appreciation of its investments. This deferred tax liability is reflected in the daily NAV and as a result, the Fund's after-tax performance could differ significantly from the underlying assets even if the pre-tax performance is closely tracked. The potential tax benefits from investing in Pass-Thru Securities depend on them being treated as partnerships for federal income tax purposes.
The TFMS HIPS Index is constructed to capture highincome securities, typically with pass-through structures, across the following sectors: (i) CEFs, (ii) mortgage REITs, (iii) commercial equity REITs, (iv) residential/diversified REITs, (v) asset management and BDCs, and (vi) energy production and energy transportation & processing companies. Energyrelated companies included in the Index are expected to primarily be structured as MLPs. CEFs included in the Index are limited to taxable, debt-based funds and may include CEFs that invest primarily in bank loans, high-yield securities (also known as “junk bonds”), foreign securities (including those in emerging markets), and mortgage- or asset-backed securities. You may not directly invest in an index.
Distribution Rate represents a single distribution from the fund and does not represent the total return to the fund. The distribution rate is calculated by annualizing the most recent distribution and dividing it by the most recent NAV.
30-Day SEC Yield is a standard yield calculation developed by the Securities and Exchange Commission that allows for fairer comparisons among bond funds. It is based on the most recent month-end. This figure reflects the interest earned during the period after deducting the Fund’s expenses for the period.
The Fund is distributed by Foreside Fund Services, LLC, which is not affiliated with GraniteShares or any of its affiliates.